Results
SGB level, nested, three learners: TabPFN 3.5, a random forest and XGBoost.
Every number below comes from the run's own metrics/ files, and the shipped
config_cfmd_category.yaml reproduces it.
This is the full analysis. The container's default demo is a small slice of it and does
not score like it.
Which food: seven categories, grouped cross-validation
The run
3,680 samples · 57 datasets · 7 food categories · SGB level · 5 grouped CV folds · nested · no class balancing · no calibration · 1 h 37 min
Mean over the five outer folds, ± the standard deviation across them:
| balanced accuracy | accuracy | log-loss | |
|---|---|---|---|
| TabPFN | 0.662 ± 0.121 | 0.801 ± 0.071 | 0.572 ± 0.118 |
| Random forest | 0.626 ± 0.157 | 0.743 ± 0.079 | 0.677 ± 0.163 |
| XGBoost | 0.634 ± 0.103 | 0.801 ± 0.061 | 0.565 ± 0.177 |
- Read the balanced-accuracy column. Dairy is 2,467 of the 3,680 samples, so answering "dairy" to everything scores 0.67 accuracy. Balanced accuracy weights the seven categories equally; its chance level is 1/7 = 0.143.
- One decision rule for all three. The predicted category is the one with the largest probability divided by that category's frequency in the fold's training samples (which category is predicted). Log-loss uses the probabilities unchanged.
- No ranking. The three means are 0.036 apart; the fold-to-fold standard deviation is 0.10–0.16. Comparing learners has the detail.
Per category
Pooled out-of-fold recall, from metrics/per_class_recall_oof.csv:
| class | n | TabPFN | random forest | XGBoost | TabPFN mistakes it for |
|---|---|---|---|---|---|
dairy |
2467 | 0.926 | 0.843 | 0.942 | fermented_grains, fruits_and_vegetables |
fermented_meat |
154 | 0.857 | 0.838 | 0.844 | meat, dairy |
meat |
197 | 0.838 | 0.756 | 0.853 | fermented_meat, fermented_grains |
fish |
141 | 0.645 | 0.631 | 0.454 | meat, fruits_and_vegetables |
fruits_and_vegetables |
224 | 0.580 | 0.688 | 0.558 | fermented_grains, fermented_meat |
fermented_grains |
75 | 0.240 | 0.320 | 0.253 | fermented_beverages, dairy |
fermented_beverages |
422 | 0.062 | 0.059 | 0.085 | fermented_grains, fruits_and_vegetables |
| mean (pooled) | 3680 | 0.593 | 0.591 | 0.570 |
The mean of a recall column is balanced accuracy over the pooled predictions. It is lower than the fold average above (0.593 against 0.662 for TabPFN): the folds differ in size (1,433 / 487 / 608 / 552 / 600 samples), and each fold's balanced accuracy averages only the categories present in its test set.
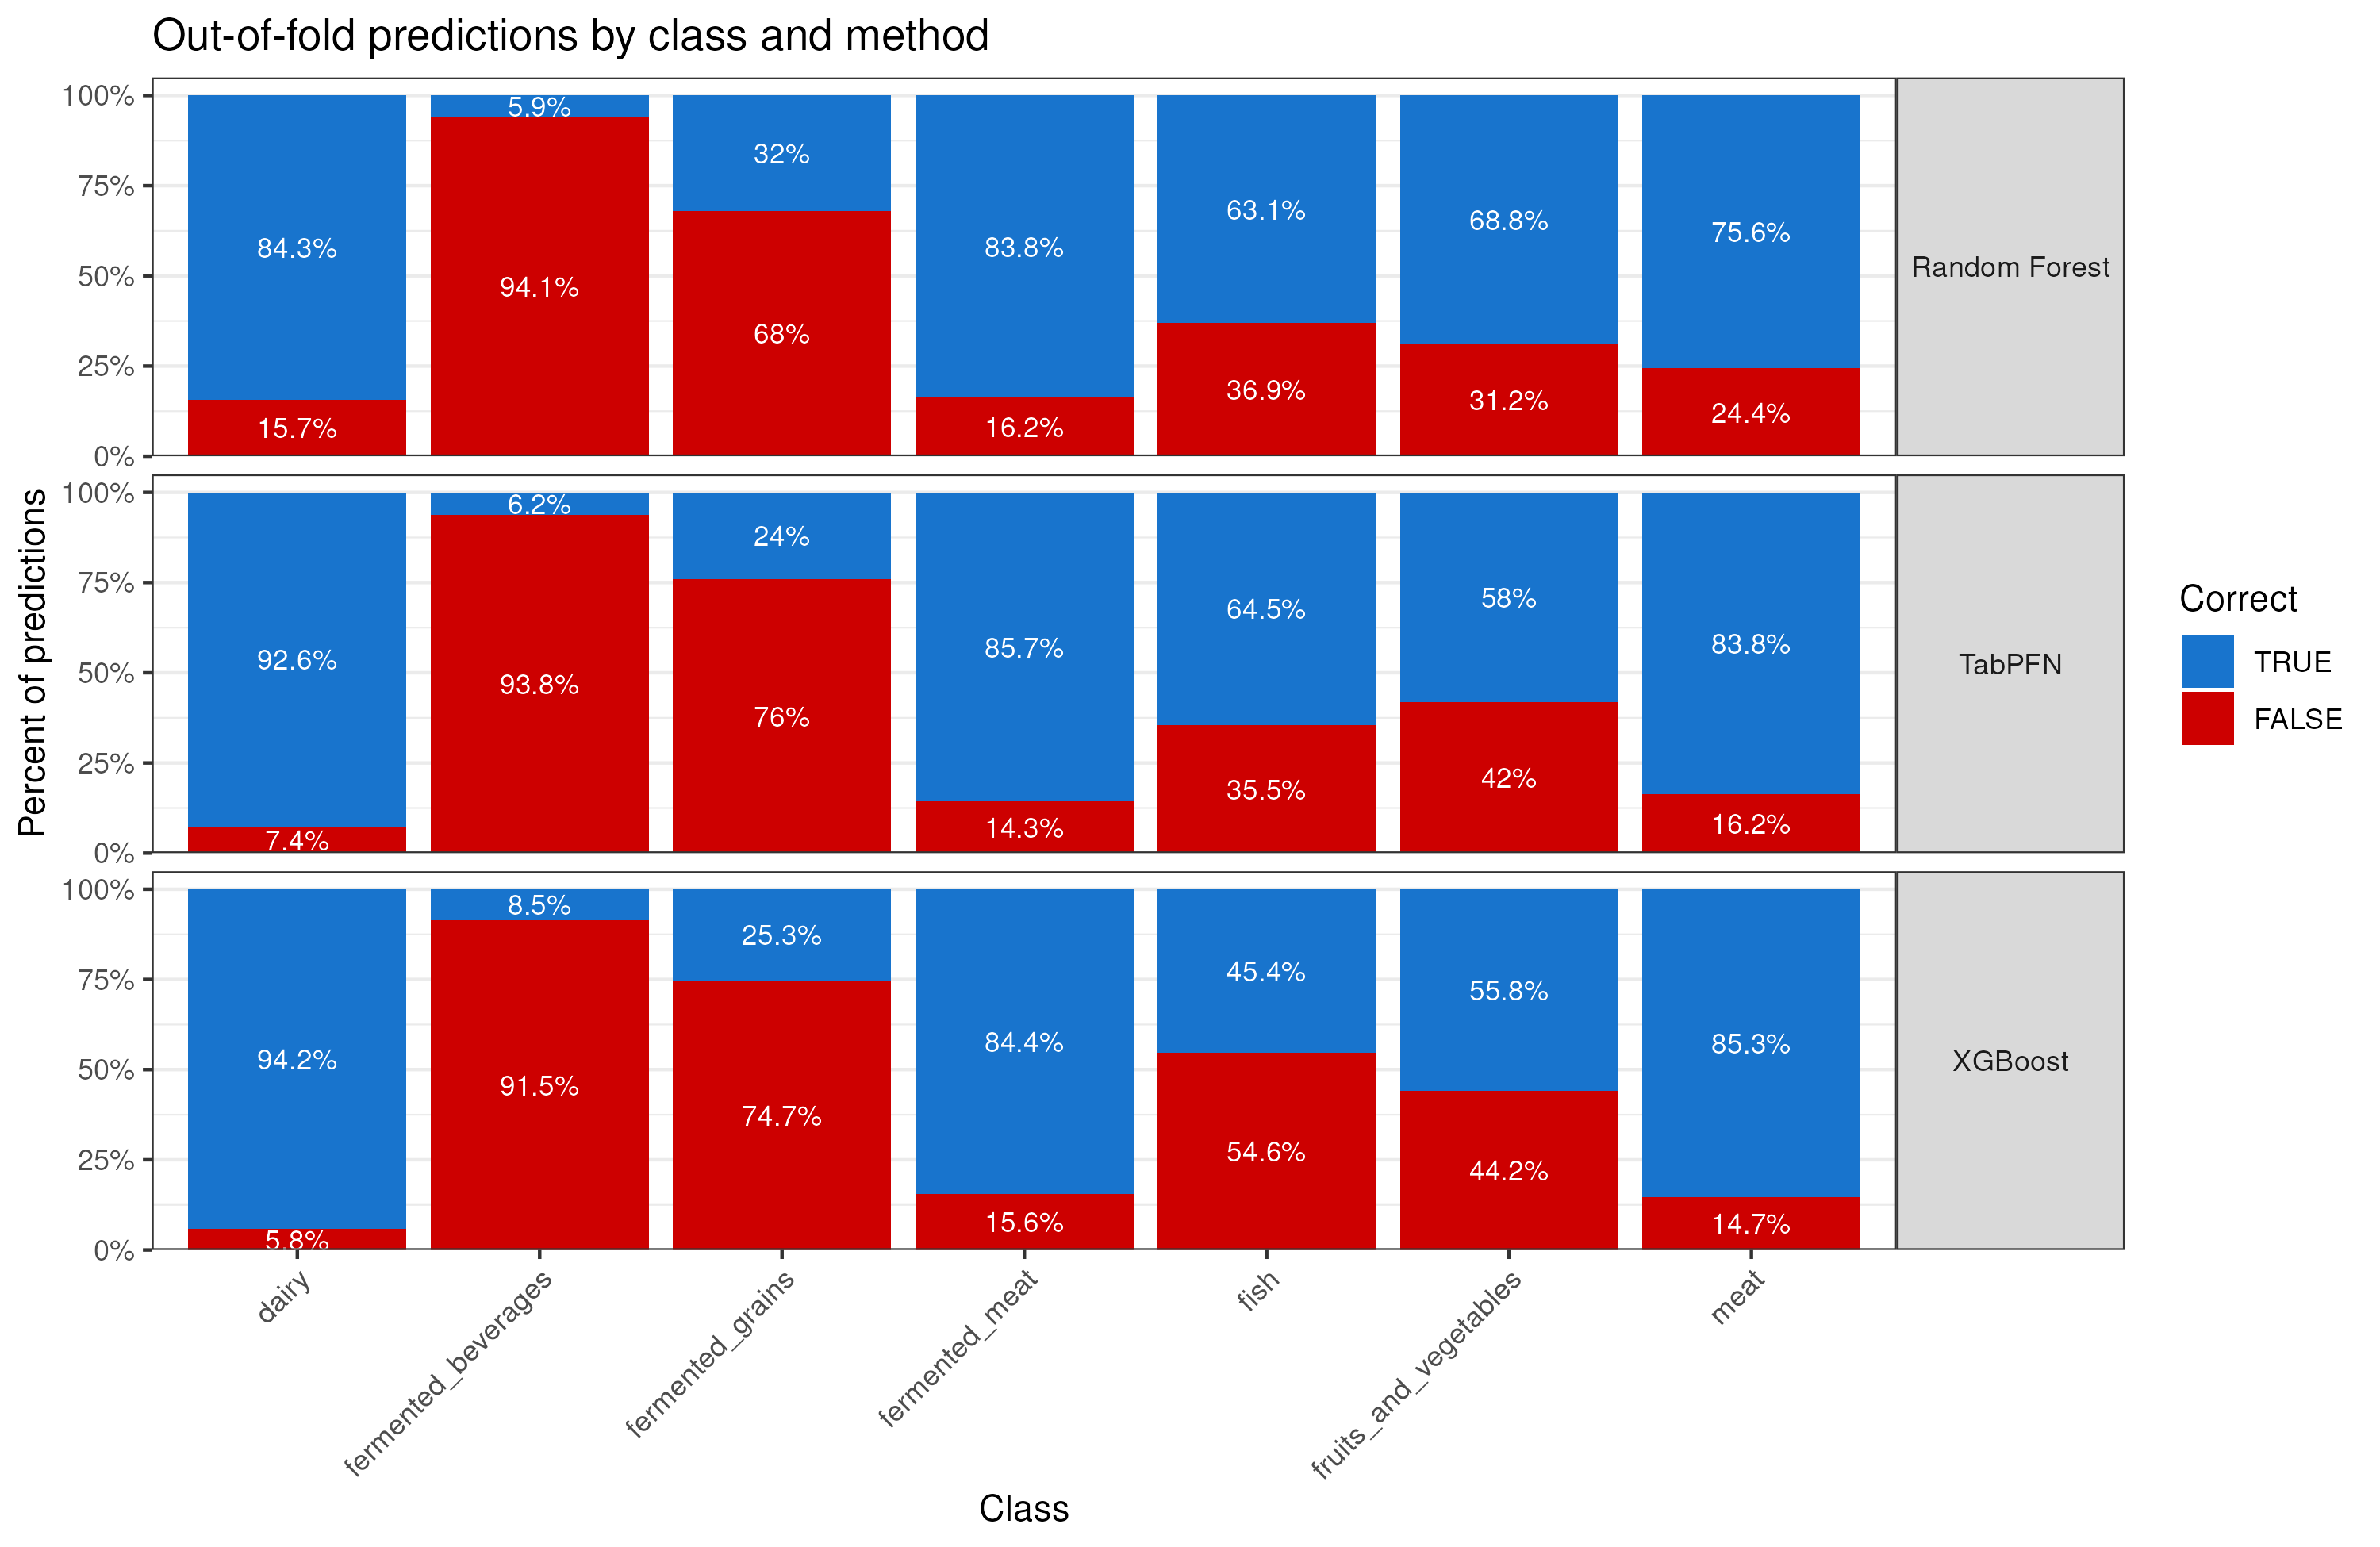
fermented_beverages: one dataset decides the row
375 of the 422 samples come from one dataset, held out in fold 1. The training part
of that fold has 47 fermented_beverages samples, from three other datasets. All
three learners assign most of the held-out dataset to fermented_grains: TabPFN 323
of 375, the forest 326, XGBoost 343. With the largest probability as the rule the
counts are 315, 308 and 237, the rest going mostly to dairy. The error is in the
probabilities, not in the decision rule. The row measures transfer from three small
studies to one large one.
fermented_grains: 75 samples in three datasets (40, 30 and 5), each held out in a different fold (4, 2 and 5). Recall 0.24–0.32. The learners emit the label 529–600 times, 18–24 of them correctly; most of the others are thefermented_beveragesdataset above.- Where the learners differ by more than 0.1:
dairy(forest 0.843, the others 0.93–0.94),fish(XGBoost 0.454, the others 0.63–0.65) andfruits_and_vegetables(forest 0.688, the others 0.56–0.58). - Confusions follow substrate and flora:
meatandfermented_meatwith each other,fishwithmeat,fermented_grainswithfermented_beverages.
Per fold
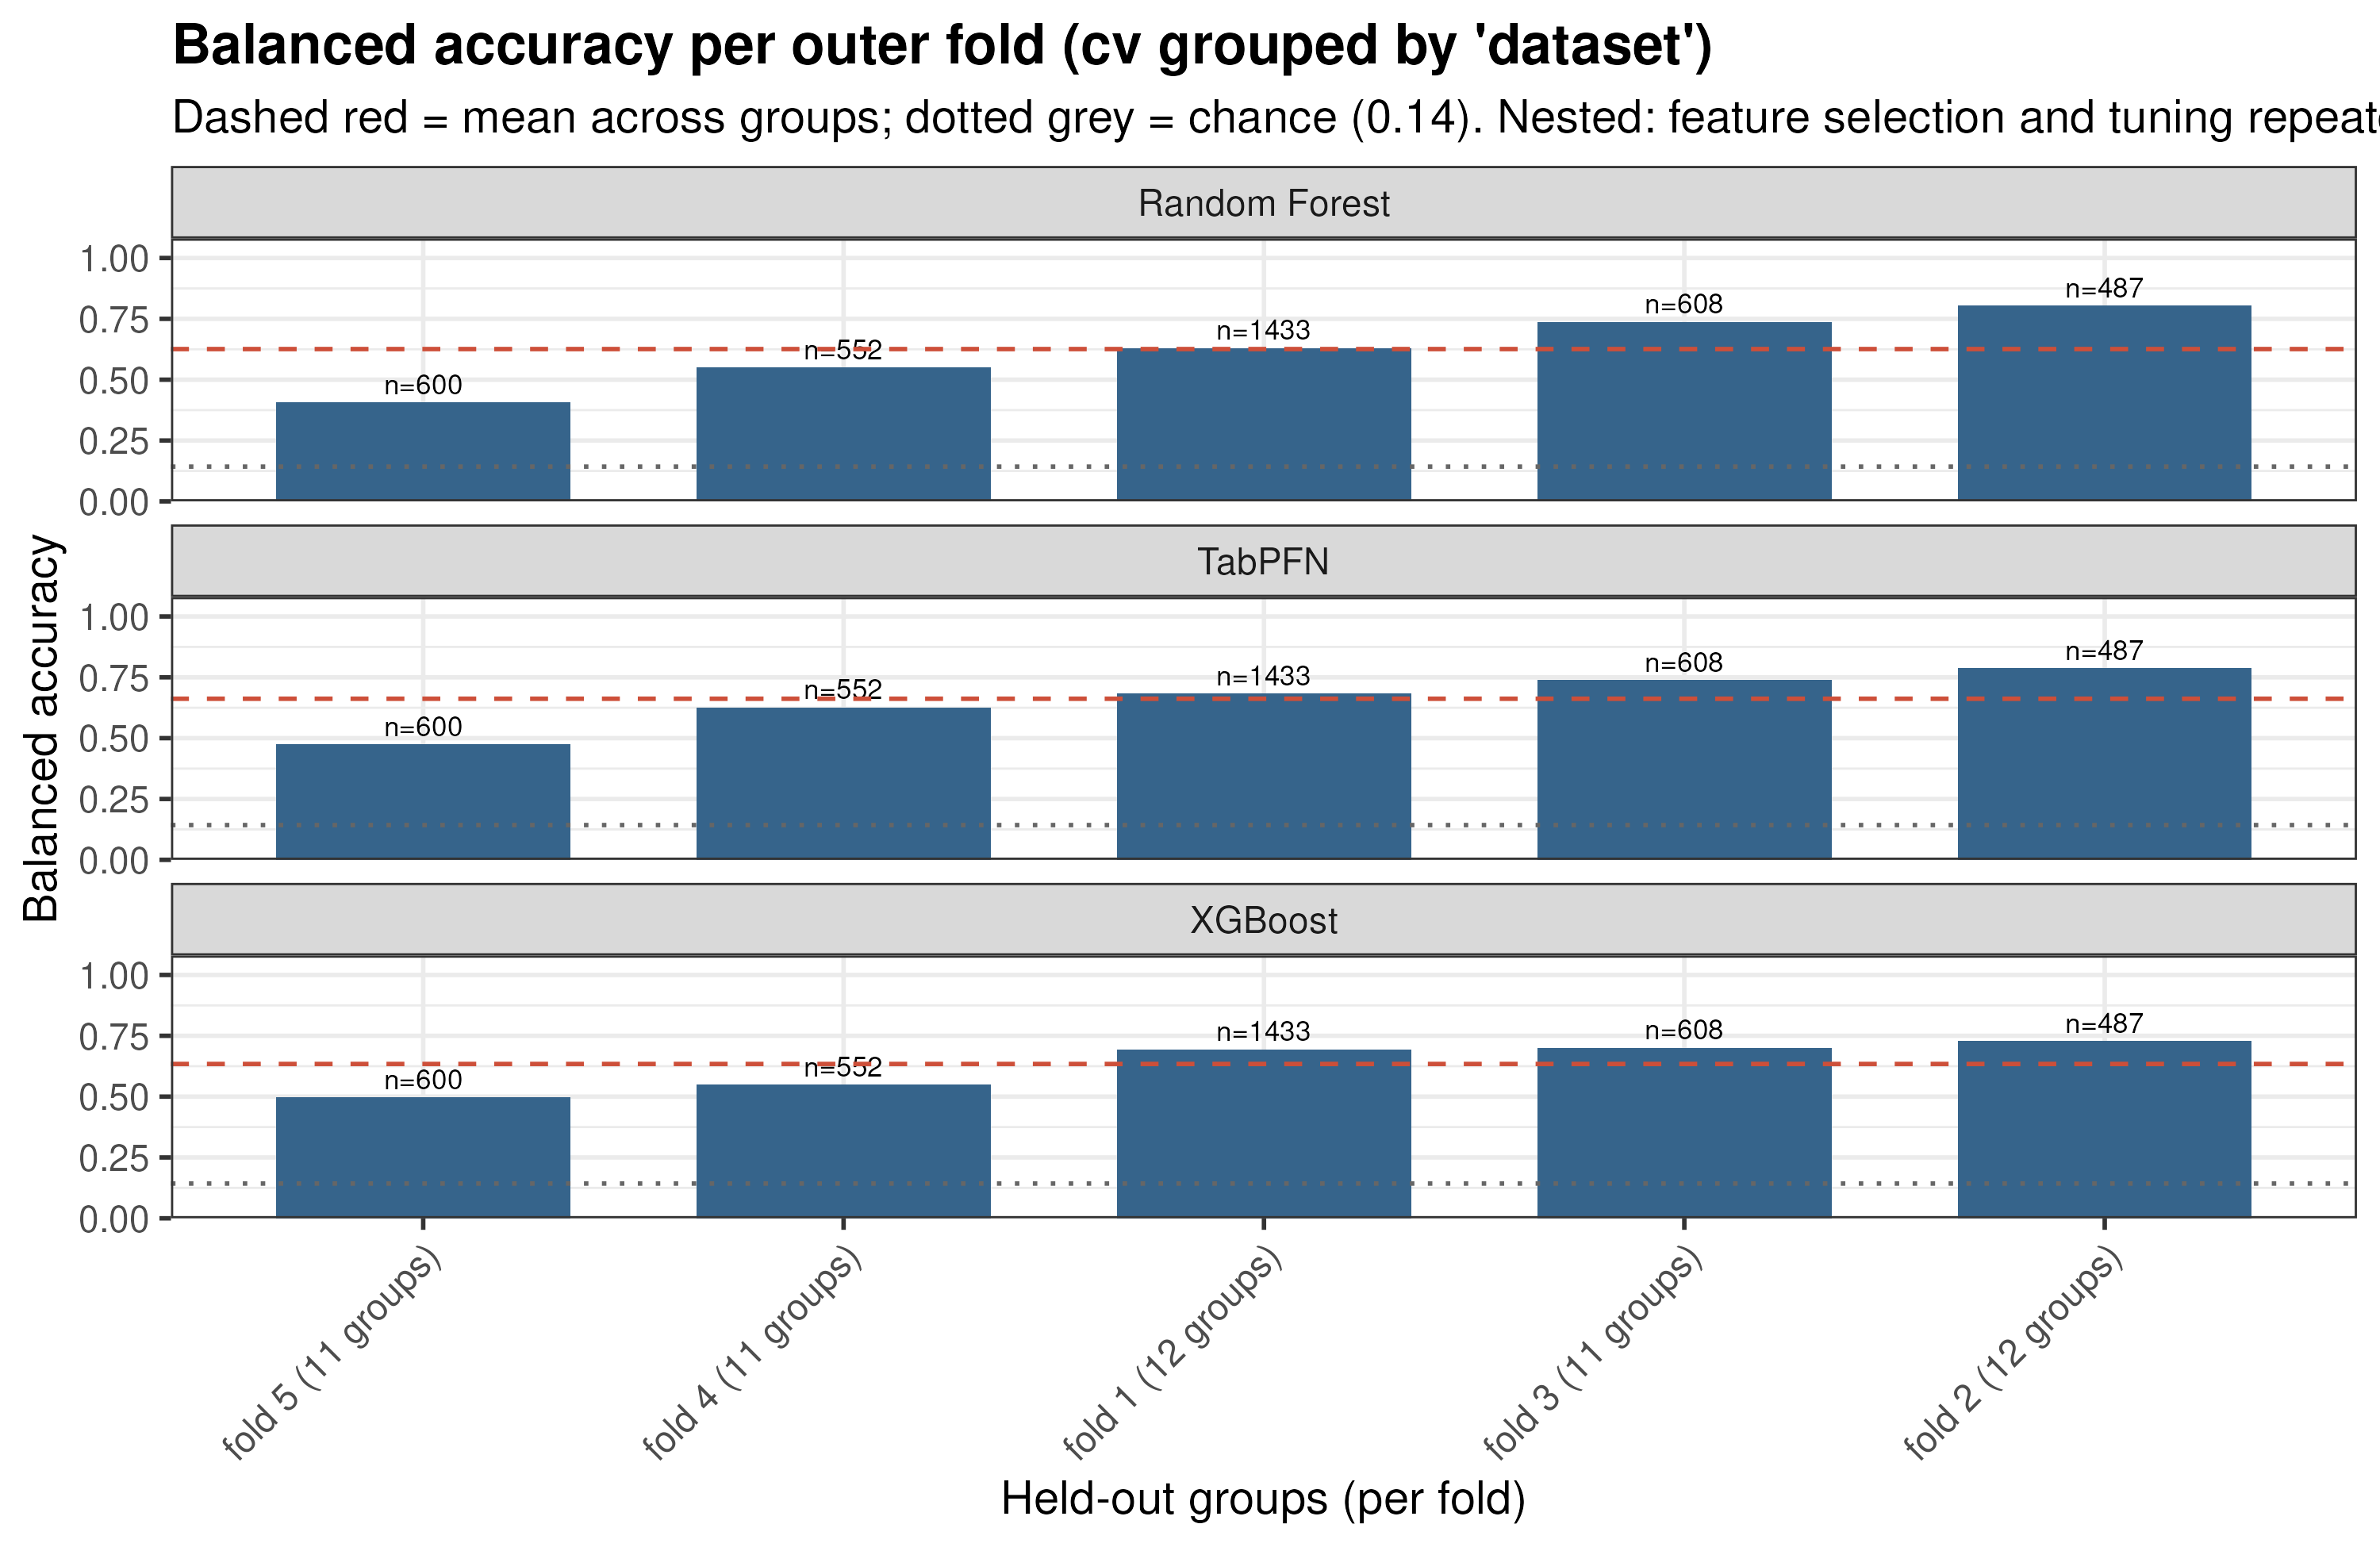
| fold | n test | TabPFN | random forest | XGBoost |
|---|---|---|---|---|
| 1 | 1433 | 0.682 | 0.630 | 0.694 |
| 2 | 487 | 0.788 | 0.805 | 0.728 |
| 3 | 608 | 0.739 | 0.737 | 0.701 |
| 4 | 552 | 0.626 | 0.550 | 0.549 |
| 5 | 600 | 0.475 | 0.406 | 0.498 |
- No learner is ahead in every fold.
- Within a fold the three are at most 0.09 apart. Across folds each spans 0.23–0.40.
- Each fold holds out 11 or 12 whole datasets; which datasets land together decides much
of the score. Fold 5's test set is 521 dairy samples out of 600, with five
fermented_grainsand ninemeat, so its balanced accuracy averages over categories with almost no samples. - Quote the mean with the spread beside it.
Which taxa
Selection is nested: it runs inside every outer fold, on that fold's training part alone,
over the full table of 7,847 SGBs. It keeps a different number each time: 125, 100, 550,
125 and 80 SGBs across the five folds. The 15 SGBs in metrics/selected_features.csv are
the final model's selection, fitted on all the training data.
SHAP is computed for TabPFN, the learner with the highest cross-validated balanced
accuracy, refitted on those 15 SGBs, over 100 training samples
(importance.tabpfn_shap_max_rows).
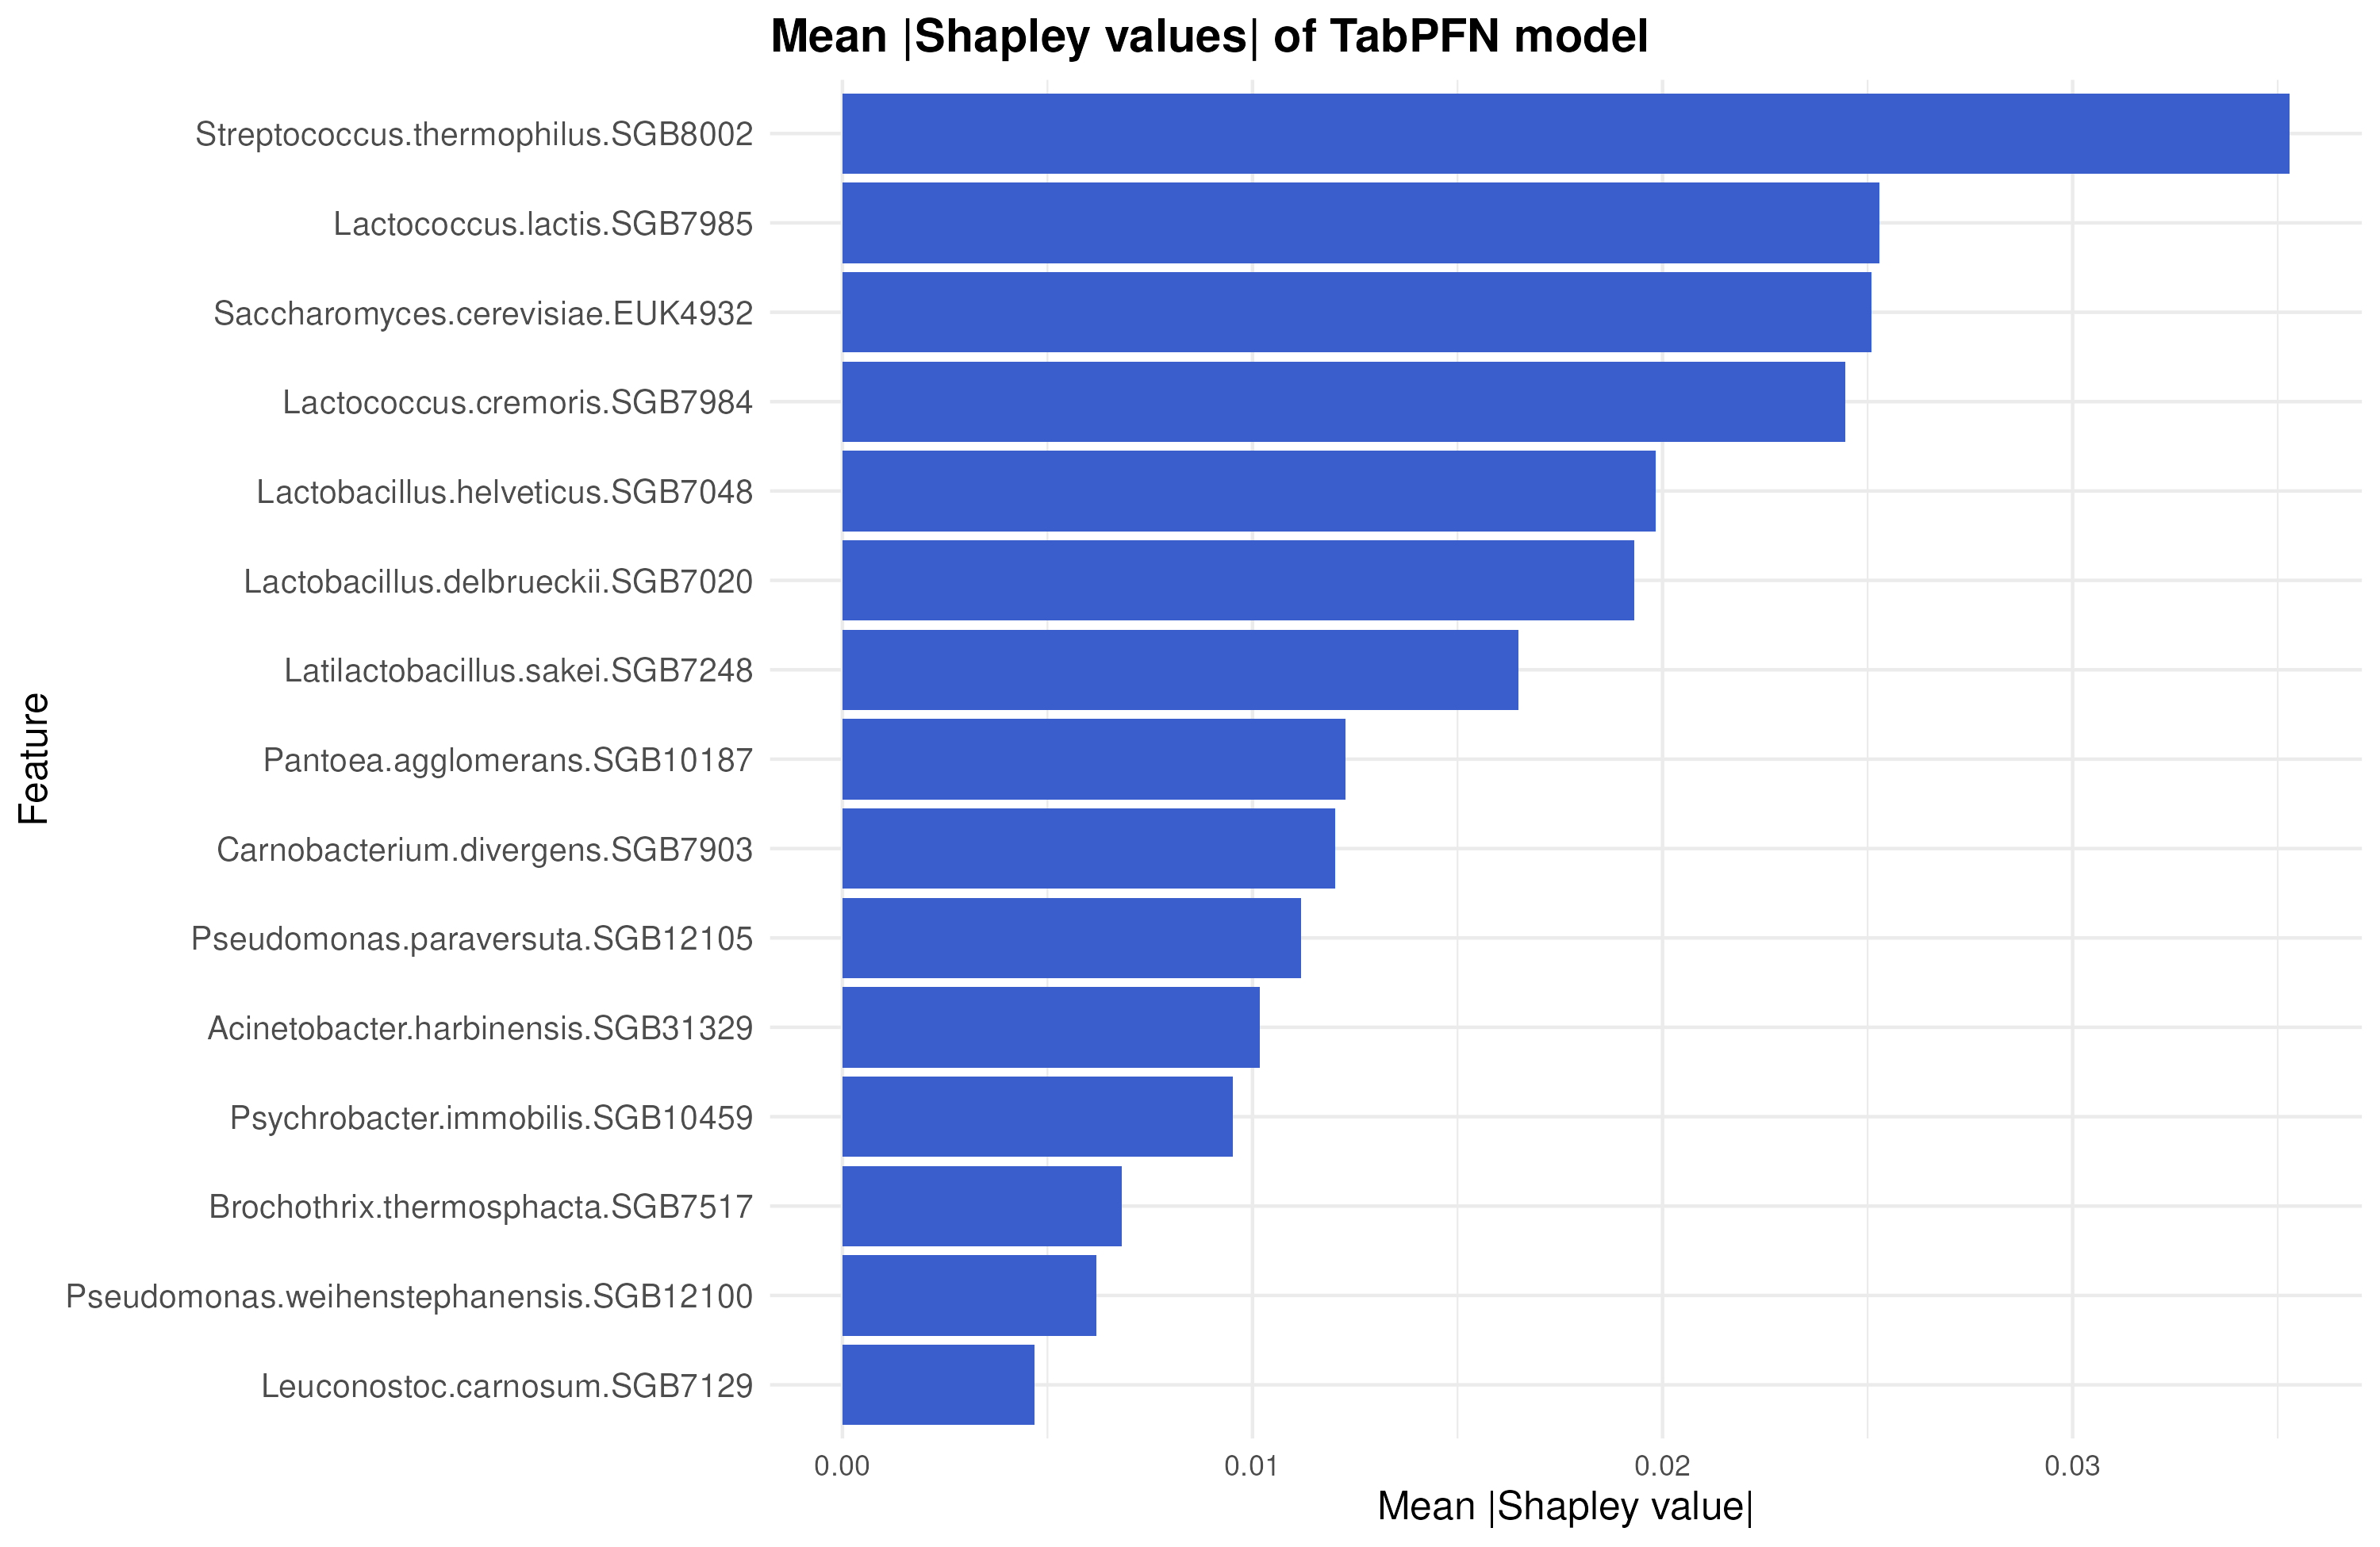
| taxon | mean |SHAP| |
|---|---|
| Streptococcus thermophilus | 0.035 |
| Lactococcus lactis | 0.025 |
| Saccharomyces cerevisiae | 0.025 |
| Lactococcus cremoris | 0.024 |
| Lactobacillus helveticus | 0.020 |
| Lactobacillus delbrueckii | 0.019 |
| Latilactobacillus sakei | 0.016 |
| Pantoea agglomerans | 0.012 |
The global ranking does not say which category a taxon speaks for. Per category, the taxa that move its predicted probability most:
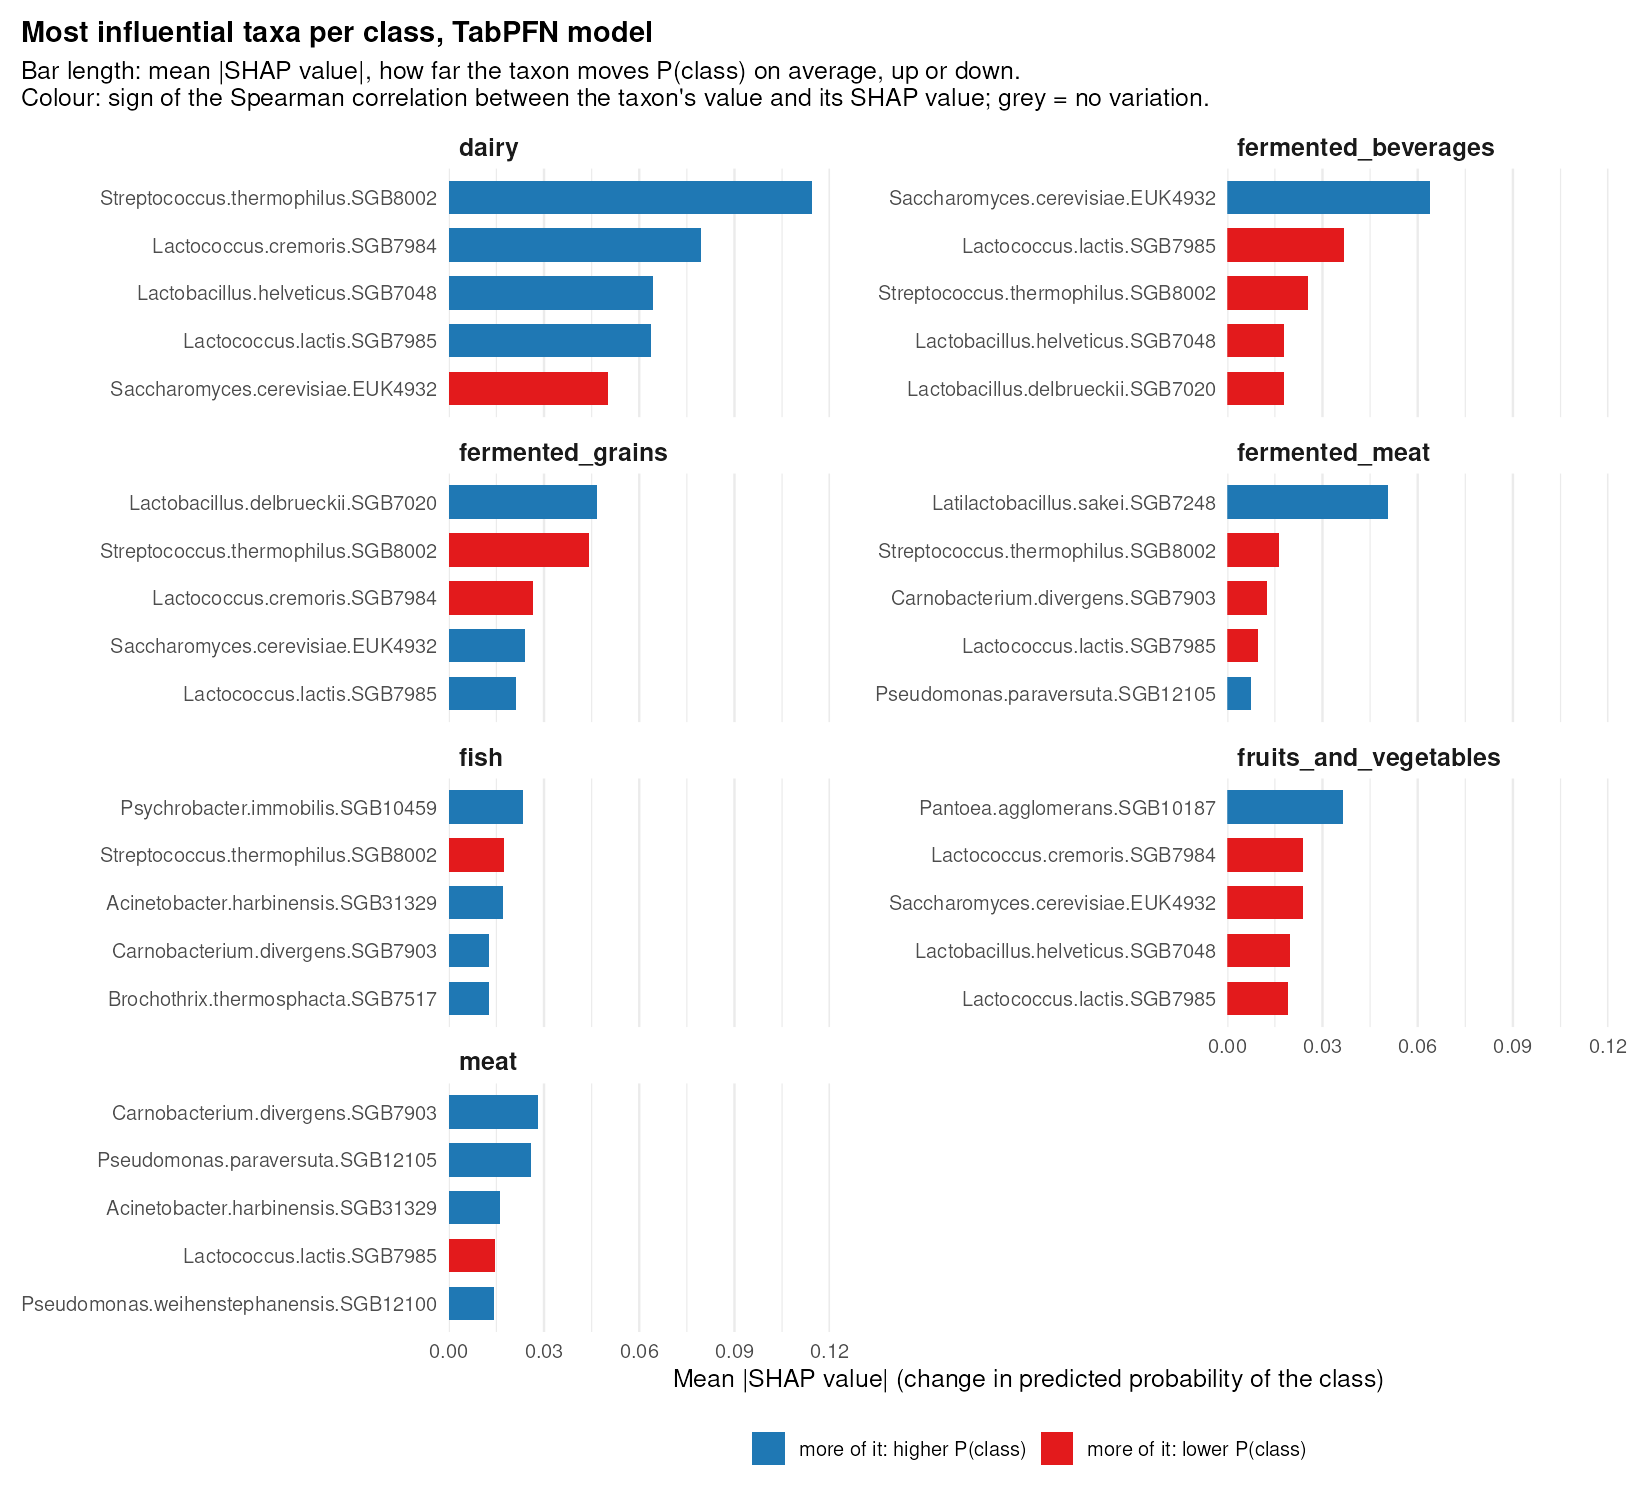
Bar length is the mean |SHAP value| for that category. Colour is the sign of the
Spearman correlation between the taxon's value and its SHAP value (direction_rho in
metrics/shap_class_contributions.csv): blue, more of the taxon raises the category's
probability; red, it lowers it. The figure is the notebook's importance_by_class,
drawn from this run's saved SHAP values.
| category | more of it raises P(category) | more of it lowers P(category) |
|---|---|---|
dairy |
S. thermophilus, L. cremoris, L. helveticus, L. lactis | S. cerevisiae |
fermented_beverages |
S. cerevisiae | L. lactis, S. thermophilus, L. helveticus, L. delbrueckii |
fermented_grains |
L. delbrueckii, S. cerevisiae, L. lactis | S. thermophilus, L. cremoris |
fermented_meat |
L. sakei, Pseudomonas paraversuta | S. thermophilus |
fish |
Psychrobacter immobilis, Acinetobacter harbinensis, Carnobacterium divergens | S. thermophilus |
fruits_and_vegetables |
Pantoea agglomerans | L. cremoris, S. cerevisiae, L. helveticus, L. lactis |
meat |
C. divergens, P. paraversuta, A. harbinensis, Pseudomonas weihenstephanensis | L. lactis |
- The table lists each category's top five taxa by mean |SHAP value|, except three
whose correlation is below 0.3 in absolute value (C. divergens and L. lactis for
fermented_meat, Brochothrix thermosphacta forfish): their SHAP values do not follow their abundance in one direction. - The dairy starter bacteria (S. thermophilus, the Lactococcus species, L. helveticus) count for dairy and against most other categories.
- Each other category has its own marker: S. cerevisiae for fermented beverages, L. delbrueckii for fermented grains, L. sakei for fermented meat, P. agglomerans for fruits and vegetables, P. immobilis for fish, C. divergens and P. paraversuta for meat.
- The SGB table carries eukaryotic bins (
EUKids) alongside the bacterial ones, hence the yeast.
What the run cost
From metrics/timings.csv:
| learner | tuning, summed over the 5 outer folds | final model |
|---|---|---|
| TabPFN | 11.1 min | 2.0 min |
| Random forest | 10.1 min | 1.6 min |
| XGBoost | 10.8 min | 1.8 min |
- Per fold: 1.6–2.2 min per learner, except fold 3 (2.7 / 3.5 / 2.7 min), whose selection kept 550 SGBs.
- The final model is tuned once on all the training data, before the outer folds run.
- TabPFN is not trained: the training table is passed as context at prediction time, so its tuning time is the cost of evaluating one fixed setting across the inner resampling.
| stage | wall clock |
|---|---|
| start-up, import, preprocessing, final selection | 2.7 min |
| final models, three learners | 5.3 min |
| outer loop: per-fold selection, tuning (32 min) and scoring | 37.5 min |
| SHAP and the report | 51.2 min |
| total | 1 h 37 min |
Reproducing it
mkdir -p out ~/.cache/tabpfn
docker run --rm --gpus all --user "$(id -u):$(id -g)" -e TABPFN_TOKEN \
  -v "$HOME/.cache/tabpfn:/work/.cache/tabpfn" -v "$PWD/out:/work/out" \
  ghcr.io/ilivius/tabflux:1.6.0 Rscript scripts/run_multi_tax_levels.R config_cfmd_category.yaml
About 1 h 37 min on a 16-core Threadripper with one RTX 4090. Only TabPFN uses the card; the forest, XGBoost, the feature selection and the SHAP pass are CPU work, so the rows of the timing tables scale with different hardware.
The figures on this page are written by the run itself, at print resolution, into
figures/ next to metrics/, as PNG and SVG both.
The across-level summary lands in
<date>_<id>_<version>_multi_tax_results/lodo_metrics_all_tax_levels.png (and .svg).